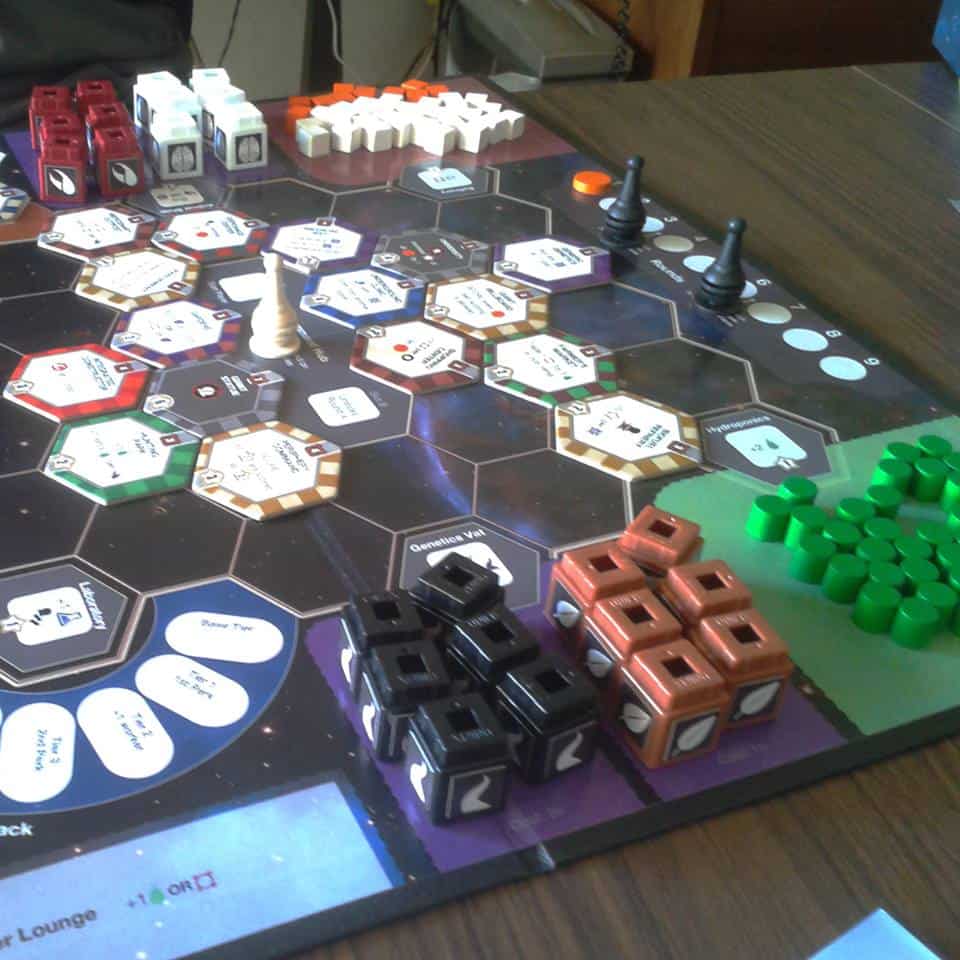
I recently did some quick Python scripting to help with a design I’m working on. It’s a board game, not a computer game — but I was able to write some short scripts that simulated key parts of the game, and report on the results. By mining the data generated by those scripts, I was able to discover some interesting relationships in the game’s design.
THE TEST CASE
People’s Republic is a multi-player card game that lies somewhere between Werewolf and Battlestar Galactica. You play as a powerful faction in the government of a fictional cold-war-era eastern european communist country. Superficially, you’re all working to build a worker’s utopia, against the forces of capitalist decadence and corruption. If you do, those players that gathered the most power during the struggle end up winning. But if you fail, the player with the least power sells out their country to the forces of evil and wins.
So it’s a traitor game, but its a *variable* traitor game. In games like Battlestar Galactica or Shadows over Camelot, the traitor is determined by random draw. In Peoples Republic, being the traitor is a decision, akin to shooting the moon in the card game Hearts.
A PROBLEM OF PROPORTION
One of the biggest challenges in People’s Republic has been balancing the scoring opportunities. Every turn, a number of alignment tokens are drawn, and the players work to either score them or block them as a whole. As a player, when you’re deciding how to play, you’re looking at how much you’re scoring, relative to the other players.
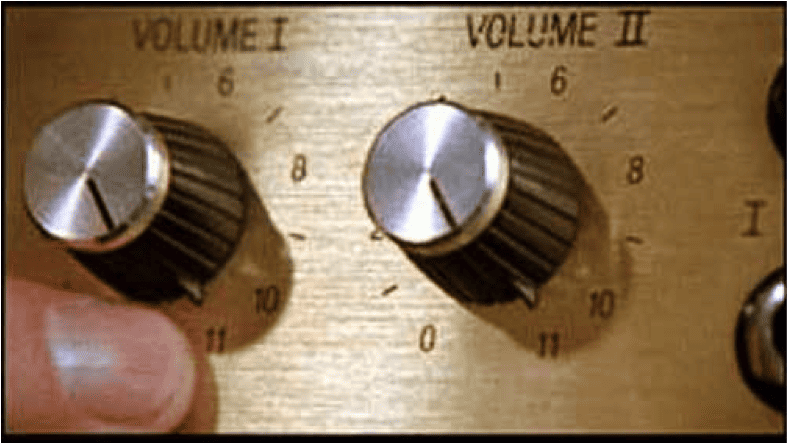
When I’m designing, I use the “dial” metaphor to describe different parts of the game that could be set at different levels. In this case, there were several dials involved with this particular mechanic:
- How many alignments each player had
- The number of tokens for each alignment
- How many total tokens are drawn per turn
On top of that, “number of players” is its own, special dial: whatever dial combinations I choose have to work with a range of player counts.
It was easy to see that different dial combinations would create different populations of token sets. By picking extremes, I could see wildly different behavior arising:
I ran a few playtests with different dial settings. I found that combinations that looked good on paper didn’t necessarily work in the wild. There were statistical forces at work that were beyond my immediate ken.
ENTER THE PYTHON
I needed to test one part of the game: the scoring distribution. I needed to test lots of different combinations of dial settings. I didn’t want to try to make my playtesters suffer through any more bad combinations. Theorycraft was only getting me so far. What to do?
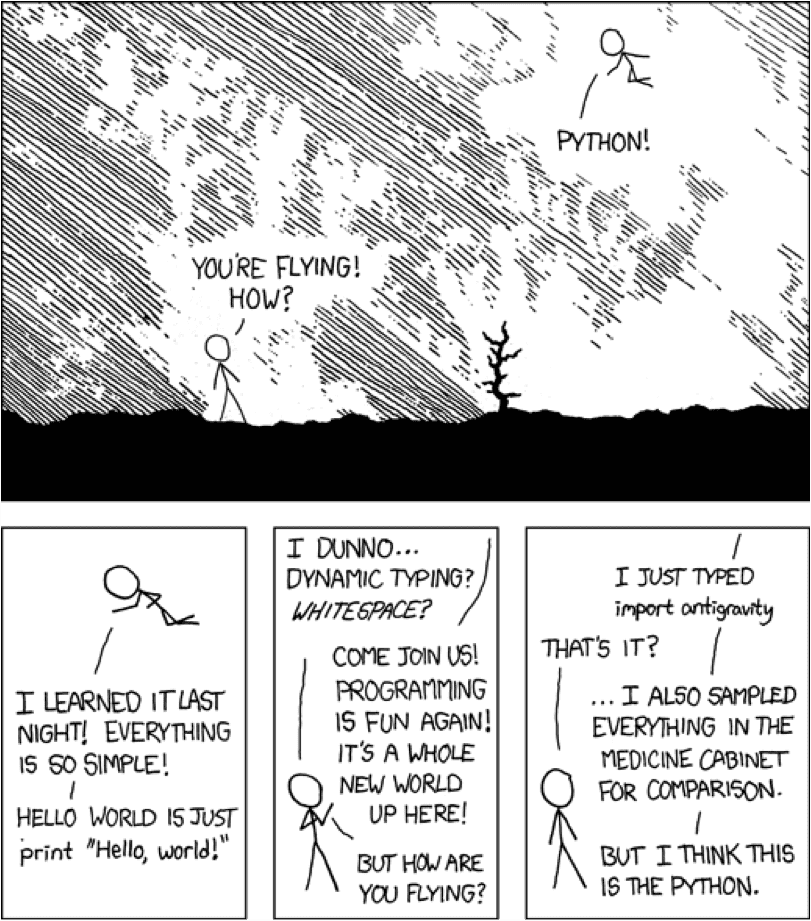
When in doubt, try Python! Python is a popular programming language. One of its many strengths: its really easy to whip up a quick script to do… whatever you want, really.
And here is your Obligatory XKCD cartoon about python:
So I figured I’d have a go at using Monte Carlo methods to gain more insight into the dial settings, and how they affected each other.
Now, doesn’t *that* sound fancy? Let me dispel your fantasies as quickly as possible: it was not. Yes, there is a real field of mathematics that does all sorts of cool stuff, and it is called Monte Carlo. Those gentle readers who are seeking a better understanding of it should look elsewhere. I, on the other hand, used the abridged technique:

Armed with my trusty text editor and a donkey-load of coffee, I proceeded to hack out a script. Those who prefer to cut to the chase may see it here. If you are savoring the drama, read on.
PART ONE: THE SIMULATION
The first step was describing the game in code — at least, the part of it that I wanted to exercise. I only really needed to write enough code to represent the abovementioned dials, and their interactions.
| from random import sample, shuffle | |
| from string import ascii_lowercase | |
| class Game(object): | |
| def __init__(self,player_count, mins_per_player, gains_per_min, gains_per_reform): | |
| self.player_count, self.mins_per_player, self.gains_per_reform, self.gains_per_min = player_count, mins_per_player, gains_per_reform, gains_per_min | |
| self.total_mins = self.player_count * self.mins_per_player | |
| self.minset = [l for l in ascii_lowercase[:self.total_mins]] | |
| self.gainset = self.minset * self.gains_per_min | |
| self.total_gains = self.total_mins * self.gains_per_min | |
| self.max_gain_coop_threshold = round(1.0 * self.gains_per_reform / self.player_count) | |
| self.player_minsets = [list() for i in xrange(self.player_count)] | |
| for minset in self.player_minsets: | |
| for mpp in xrange(self.mins_per_player): minset.append(self.minset.pop()) | |
| self.trials = 0 | |
| self.stats = { ‘aligns’: {‘coop’:0,‘split’:0,‘defect’:0} } | |
| def execute(self,trials): | |
| for i in xrange(trials): | |
| r = Round(self) | |
| r.execute() | |
| self.trials += 1 | |
| self.count(‘aligns’,r.balance,1) | |
| def count(self,stat,key,amount): | |
| try: self.stats[stat][key] += amount | |
| except: self.stats[stat][key] = amount | |
| class Round(object): | |
| def __init__(self,game): | |
| self.game = game | |
| self.gains = [] | |
| def execute(self): | |
| self.gains = sample(self.game.gainset, self.game.gains_per_reform) | |
| self.player_gains = [] | |
| for minset in self.game.player_minsets: | |
| self.player_gains.append( sum([self.gains.count(min) for min in minset])) | |
| self.player_gains.sort() | |
| self.calculate_alignments() | |
| def calculate_alignments(self): | |
| self.defects, self.coops = 0, 0 | |
| for cur_p in self.player_gains: | |
| net_change = 0 | |
| for other_p in self.player_gains: net_change += (cur_p – other_p) | |
| if net_change > 0: self.defects += 1 | |
| else: self.coops += 1 | |
| if self.defects > self.coops: self.balance = “defect” | |
| elif self.coops > self.defects: self.balance = “coop” | |
| else: self.balance = “split” |
The actual game logic isn’t that important; here’s what the code does:
PART TWO: RUNNING IT A MILLION TIMES
Once you’ve got a class that runs the game and tracks the results, it’s easy to run it a million times:
| configs = {3: [3,4,5], | |
| 4: [4,5,6], | |
| 5: [2,3,4,5,6,7,8], | |
| 6: [2,3,4,5]} | |
| MINISTRIES_PER_PLAYER = (1,2,3) | |
| GAINS_PER_MINISTRY = (1,2,3,4) | |
| for p, gprset in configs.iteritems(): | |
| for mpp in MINISTRIES_PER_PLAYER: | |
| for gpr in gprset: | |
| for gpm in GAINS_PER_MINISTRY: | |
| if (gpr > (p * mpp * gpm)): continue | |
| if (p * mpp) > 20: continue | |
| g = Game(p,mpp,gpm,gpr) | |
| g.execute(1000) |
Again, never mind the poorly-named variables that are specific to People’s Republic. The important bit here is that it’s running through tons of different permutations of dial settings. For each permutation, it’s running a 1000-round simulation of the game.
PART THREE: SEE WHAT HAPPENS
Well, that’s great! We’re running all these simulations… but what are the results? I decided to keep it as simple as possible: I had my script print the results in columns, separated by tabs:
| from random import sample, shuffle | |
| from string import ascii_lowercase | |
| class Game(object): | |
| # added to the existing object… | |
| @classmethod | |
| def header(cls): | |
| f = (‘players’,‘mins/player’,‘total mins’,‘gains/min’,‘total gains’,‘gains/reform’,‘coop thresh’,‘align coop’,‘align split’,‘align defect’) | |
| return “t“.join(f) | |
| def out(self): | |
| f = [self.player_count, self.mins_per_player, self.total_mins, self.gains_per_min, self.total_gains, self.gains_per_reform, self.max_gain_coop_threshold] | |
| f = f + [“%0.3f” % (1.0*self.stats[‘aligns’][k]/self.trials) for k in [‘coop’,‘split’,‘defect’]] | |
| return “t“.join([str(i) for i in f]) | |
| # meanwhile, back at the loop… | |
| print Game.header() | |
| for p, gprset in configs.iteritems(): | |
| # that really | |
| # deep | |
| # nested loop | |
| g = Game(p,mpp,gpm,gpr) | |
| g.execute(1000) | |
| print g.out() |
It was then a simple matter to run the script…
C:PRScriptingpython pr.py > prout.txt
… then open the file in OpenOffice…
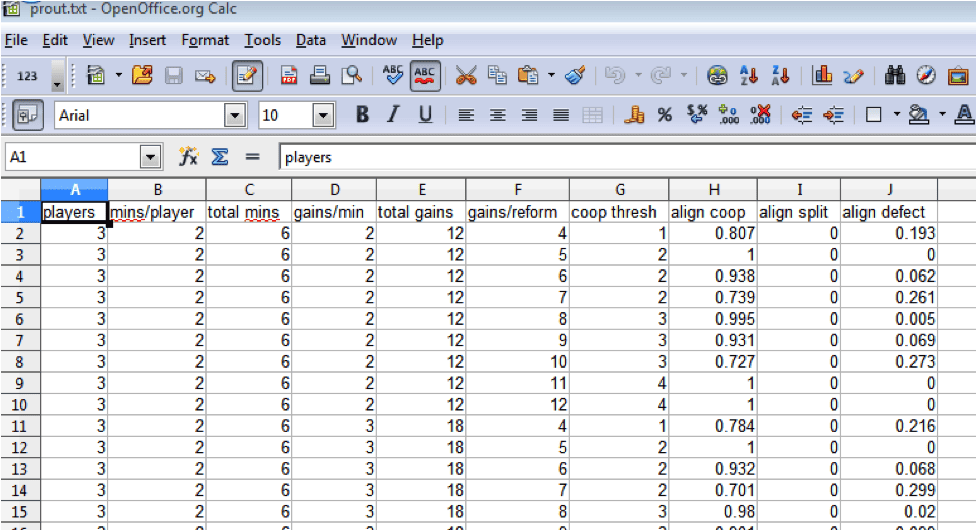
And voila! Data to explore! I now know, for every dial setting combination, what proportion of the rounds will favor a team win vs an anti-team win. I can use OpenOffice to sort, filter, and browse the data, looking for combinations that have the kind of proportions I’m looking for.
AND AGAIN… AND AGAIN… AND AGAIN…
I’ll definitely try this technique again, the next time I’m faced with a bunch of dials and a game mechanic that I can easily model in code. There’s a lot of things I would do differently, primarily having to do with separating the game logic from the execution and reporting. But for a short afternoon’s work, I got a lot of visibility into a system that I couldn’t have had otherwise.
Have you ever used scripting to help solve a design problem? Got any thoughts on different tools or approaches? Do you actually know something about Monte Carlo simulations? Leave us a comment!